Showing posts with label Google Analytics. Show all posts

Monday, May 6, 2013

How should Google Instant change your next campaign?


Probably, but not how you might have expected.

For those of you who don’t use Google as your default search engine...Click Here
Anyway, Google Chrome instant search is a real-time search tool that allows users to more rapidly search for things on the internet . Extremely convenient, as you can see below, the search uses algorithms to auto predict your search results based upon
the most commonly typed in phrases or words. In fact, Google states that it can save 2-5 seconds for every search on Google. For me, someone who has more than 200 searches a day (i know, i have counted), that is a substantial amount of time. Here is a cool link that shows how the search works.


In the search below i just typed in the query ‘wher’ and this is what is returned:



Because it is in grey in the search box, the search results will have ready been presented in the window below:
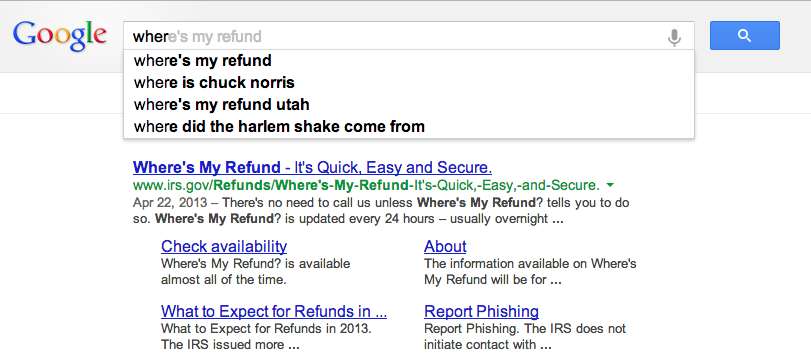


It is May 6, when i am writing this so you can see why the “Where’s my refund check,” may be the most frequently searched phrase. Popularity, within context, is one of the main reasons for the higher results, but Google asserts that all suggested results, impressions, are based upon ‘real-user searches.’ But i didn’t want to search for “Where’s my refund check,” but rather “where to buy Lime Green Jackets?” So did i just give an impression for “where’s my refund check?”


While a great example of instant searches,  let’s take another example of an instant product search. If you open up your browser to google.com and type in the “Nike air max 201” you will see a suggested list like 2013 and 2012, but what is really interesting are the results that are presented below. Remember, we haven’t hit enter yet, but our results are still being displayed. If you drop select the “2012” in the suggested list, you should get a result list like this:
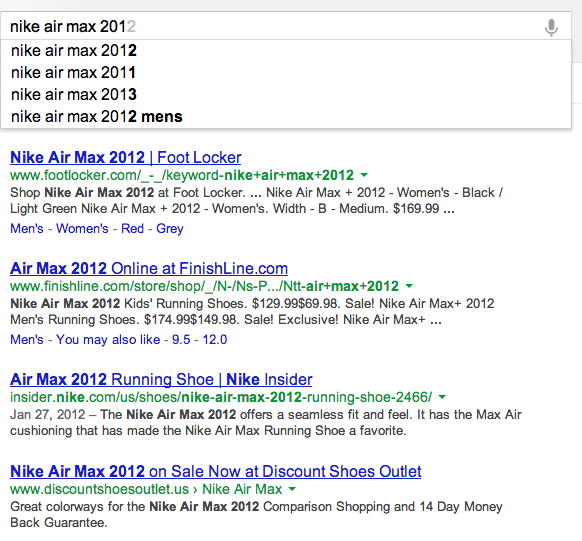
Any results that lists Nike in the domain is third in our organic searches list. Now instead of selecting the “2012” result in the search bar, select the “2013” and watch how your results differ. Now we see “nike” domain in the top slot. Is Nike paying extra for the keyword “2013” or is google instant search playing with things? If we just search for “nike air max”, Nike is the top two results. It is noteworthy, that is your were searching specifically for 2013 Nike Air Max shoes, you would have seen the results for the 2012 shoes first. Is this an incorrect impression?


After researching several sites, including Google, it is said the Google Instant will NOT be affecting your PPC data or your analytics data. Impressions, for instances, are only counted when a search term is clicked, the greyed suggested term is selected with an ‘enter’, or if you stop typing on a search query for more than three seconds. Google also believes, naturally, that instant search should actaully improve your impressions data over time because it will lead to less incorrect search or impressions, as users will see the results beforehand and be able to adjust their search terms appropriately. 

Seems like a reasonable way to ensure quality impression data, but where things may see a difference is in the AdWord campaign that you may be using. Google admits that your AdWord campaigns will need a tweak from your original campaign purchases. One thing that is always a question, is do you buy “hotel” or “hotels”? Before, you may have wanted to purchase “hotel” as it was shorter, but now it seems like Google Instant prefers “hotels” over “hotel” in the suggested 
results.

What is strange is that Google Trends shows that “hotel” is a much more frequently searched term than “hotels”.

So it would seem it is hard to pinpoint exactly which AdWord term would be a better fit. Of course, if you have the funds, you could always purchase both.


Throughout my research on this topic, the article by David Iwanow, on SearchEngineJournal.com was by far the most thorough. If you plan on reading more on this topic I highly recommend it. Link

So how does this change the way you prepare for your next campaign?


Saturday, February 16, 2013

Uploading Costs to Determine ROI


      So what it the point of all of this analytics? Is it to run frequent reports and setup custom dashboards? Is it to print fancy infographics that tell a story without providing any real insight? Analysts need to realize that the reason why companies invest efforts in employing these tools is to simply generate more money. Sounds obvious. Yet many organizations blindly implement web analytics tools without developing strategies and measurements that allow for insight into the effectiveness of marketing campaigns across all ad networks. Without an effective way of measuring the ROI of all web based advertisement campaigns, companies can not gain insight into which techniques are generating the most money. 
       
     Google Analytics provides plug-ins that provide easy ROI reporting for advertisement campaigns that are generated through Google's online marketing tools. Information about advertisement campaigns implemented in Google Adwords can be linked to a GA account to allow for the baked in reporting tools to be used in Adword ROI analysis. But what about other online advertisement campaigns (Facebook,Bing, partner sites)? If the goal is to utilize analytics to make money, then organizations need to analyze which advertisement campaigns are the most effective across all ad networks .
                 
       GA provides tools for users that allow for non Google ad network cost data to be uploaded from files (excel spreadsheets) into the GA suite. Uploading daily costs data allows for a one stop web analytics experience where all relevant online advertisement costs and statistics are merged together, allowing for reflection on the effectiveness of specific marketing efforts.

Where to Start?

        Before we can start uploading data into GA, we need to make sure our advertisement links are created in Google's URL builder tool. Utilizing the builder allows us to maintain effective management across campaigns, mediums, and sources[1]. Please refer to Bryce Bagley's excellent post excellent post on how to accomplish this.


      Once our URLs have been built, we then need to develop a spreadsheet that contains information that will allow us to track what campaigns we are currently running, what kind of traffic they generated, and how much they cost. Advertisement tools outside of Google’s ad network also can provide these same statistics. Google provides guidelines on what data can be uploaded and it's format.[2]


     Before we can start uploading data into GA, we need to make sure our data is formatted in a specific way that allows for Google's API to read it. Companies should format spreadsheets according to the dimensions and metrics shown in the table above. However, many companies may have spreadsheets that look similar to this one.


      Google’s data upload API is unable to read the file due to the titles in the columns being unrecognizable by the tool. However, it is easy to reformat into a API friendly file.


     You will notice that the spreadsheet contains aspects such as source, medium, and campaign name which refer back to the original URL that was generated for our advertisement link. The data will upload and associate itself to the specific campaign that we created. [3]

How to upload the Data

     Before we can upload the data, we must make sure that our spreadsheet file has been formatted appropriately and saved in the .CVS file format. This format is an option when saving files in excel. Once our files are ready, we can upload our data using Google’s free self service API or an independent GA application provider for a cost.

Google's Self Service API:

This method involves an intermediate knowledge of how to utilize API's and a small bit of scripting logic. Due to this falling outside the realm of this course, I have attached several tutorials on how to set up API access in Google's developer tools and how to enable data uploading in GA. [4]

API Demo

Independent Application Providers.

     Many companies have developed tools that allow for easy data integration from excel into GA. These tools provide the same functionality while providing an easy to use graphical user interface. A tool provided by Next analytics provides the ability to pull informaton from the web into excel for analysis, while another another application by GA DataUploader pushes data from excel into GA. For more information on applications that provide additional tools in GA please visit the App Gallery. [5]


GA Data Uploader Demo

Analysis through Reporting

     Once the data has been uploaded (which can take up to 12 hours) we can take a look at the effectiveness of the campaigns in relation to one another using the built in GA tools.

     Organizations must look at ROI holistically. Viewing a report showing the ROI analysis of a single advertisement campaign only tells you only a part of the story. It is through the compiling of all advertisement endeavors that allow for an understanding of how our efforts are effecting the bottom line. Yet even then, organizations need to continue to revisit the ROI that the analytics team bring to the table.

References:


Wednesday, February 13, 2013

Metrification Autometrically!

Metrics! Metrics! Metrics!  If I have to hear that word one more time I think I might just scream like Doc Brown at the end of Back to the Future II. 

GREAT SCOTT!!  I thought I sent Metric McFly back to the future!

But, that's the life of a web analyst.  They look at metrics everyday.  They read metrics everyday.  They dream about page view percentages and average time on a site.  They search through blogs and books about how to improve their SEO.  They attend conferences and workshops with names like the eMetrics Summit or any of the following:  SearchFest, Social Media & Web Analytics Innovation (try repeating that five times really fast!), or Webstock (which is like Woodstock, just without all of the drugs, half-naked people dancing everywhere and the legendary Santana and Jimi Hendrix).

Let me rephrase that, they devour metrics like 30 year old's devour Alphabits cereal.

Is that a bowl of Alphabits?!  NO, fool it's an ice cold bowl of metrics! Eat up!
Metrics are like the blood that pumps through the veins of web analysts.  They devote hours to scouring metrics with a combination of tools like Omniture, WebTrends and Google Analytics, just to name a few.  They bust out metrics at a party like ghostbusters bust ghosts.  They have Photoshopped pictures of themselves hanging out with Avinash Kaushik....what you don't know who that is?!  Click here for some edumication.

LET'S GET METRICAL!

To further educate yourself in the ways of the web analyst there are is little metrics lingo that you will need to brush up on so you don't look like a complete maroon when attending those really neat conferences I previously mentioned above.

For example, you should know a little about the following:
  • Page Views - the amount of times a page on a website has been viewed.  These can be viewed by new, repeat or a return visitor.
  • Entry page - which is generally the very first page on a website that is viewed.  For example when you visit Walmart.com, that first page is the entry page.
  • Exit page - is the opposite of the entry page!  Exactly!  It is the last page you left from a website.  
  • Bounce Rate - is basically the rate of how many times a visitor exited a page on a website versus those that have stayed on the page.  For example, say you go to the Walmart.com link and search for motor oil.  Then you decide that Autozone has motor oil to and for a better price, so you type in your address bar www.autozone.com.  You bounced from the Walmart page to the Autozone page.
  • Conversion - this is a measurement of how many visitors have performed or completed some action on the web page.  For example, purchasing an item from Amazon.com or initiating a download from a website.  
  • Count - which is a measurement of how many visitors have entered a page on a website
  • Average time on Site - How long did visitors stay on your site.
Now with some lingo under your belt, your almost ready to get started into the world of web analytics.  The next step is to understand exactly how some of these measurements are categorized.  Generally there are 3 categories that metrics fall under:
  1. Individual - Activity of a single web visitor for a defined period of time.
  2. Aggregate - Total site traffic for a defined period of time.
  3. Segmented - A subset of the site traffic for a defined period of time, filtered in some way to gain greater analytical insight.[1]
The next step to understand, is that all of these metrics are the results of visitors...visiting a website.  This brings us back to another set of important metric lingo...visitors...


Not these visitors!


These visitors....


There are three types of visitors in the web analyst lingo.
  1. New Visitors - Are visitors that have visited a website for the first time.
  2. Return Visitors - Are visitors that have returned to the website.
  3. Repeating Visitors - Visitors that have repeatedly visited a website during a specified time.
  4. Unique Visitors - Wait didn't I say that there are 3 types of visitors?!  I did, and I am glad you caught that, because that means you are actually reading this post!
The three types of visitors: New, Return, and Repeating, are considered part of  Unique visitors.  Unique visitor is defined as "the number of individuals within a designated reporting timeframe, with activity consisting of one or more visits to a site.  Each visitor is only counted once in the unique visitor measure for the reporting period."[2]

So...uh..What Does All This Mean?

Now that you understand some of the basics it's now time to jump into the why of web analytics?  One metric to notice when you are testing out some analytics tools on your website, is the Average Time on Site.  For example, why were the visitors on your site so long?  

Were they engrossed in a web article like this one 
V-Day Special, How Web Analytics is a lot like Dating or were they staring off into space?  It's a good idea to figure that one out.  

If you have a shopping cart on your site, it's a good idea to ask yourself how long did it take for a visitor to get there and make a purchase.  How many of those visitors were new visitors?  There's a metric for that too!  

So what do you do with all of these metrics?  Like any good web analyst you search for patterns.  

Do you see a pattern? Hmmm...keep looking.
Web analysts are excellent at finding patterns within their metrics.  They can see why visitors spent too much time on their website or why they bounced out after 30 seconds off a specific page.  All of these metrics set patterns and trends that are used to figure out how to improve conversion rates on a website...which is that completed event thing I mentioned before.  

What do these trends tell you?

This is the Bounce rate of this blog.

This is the Number of Visits to this blog.

This is the Percentage of New Visits on this blog
The peaks tell us that there were quite a few that visited this blog on that specific date while the valleys are the opposite.  The same can be said of the bounce rate and the % New Visitors.  Since this blog first got started in January we have had 3,771 visitors, 2,067 of them unique with an average bounce rate of 60.81%.

From these trends we can also see from where our visitors are coming from:

The darker green = where most of the visitors are coming from.
Here you can see the the United States is the main visitor demographic with India in second place.
So far what does all of this tell us?  The majority of our visitors are from the United States and let's see what page is the most viewed....looks like with a total of 10,039 page views that the post in the lead is customer analytics incorporating with 264 page views.  Ah, but look at the unique visitors!  The blog post about the problems with google analytics is leading the pack.


SO....with all of this new information swirling around your brain, it's a good idea to let it sit for awhile.  And while you're at it, read some other more interesting posts like these for our blog site:


The time has come to end this post before I get a higher bounce rate!  Please read other posts while on this site to get those rates up!  

Related Resources


Bringing Traffic Your Way


You just created that awesome blog site, and your family and friends are proud of you and your work. They come to visit the site a few times a week, reading and commenting on your posts; they actually let you know how cool you are for writing these posts! 
But, you want to tell the world about your blog. You want to start driving traffic your way! Well, I’m going to help you with some cool ideas so your blog can get your first 1 million hits.

 Social Media Working for You 

You did it! Your blog is looking pretty awesome. You have created a cool brand and now you’re ready to take it to the next level. Here’s where social media can help immensely. Go to Facebook, Twitter, LinkedIn and Google+ to create your precious brand personal accounts. Even if you believe your blog won’t be a success right away, is better to avoid headaches by creating your own accounts on every social networking site.
Now that you have created accounts on these, it’s time to start sharing every post to them. Make sure to invite friends to like or join your name so they receive notifications and or emails every time you post a new blog.


Using Analytics to Track Everything

Install Analytics Tools on your blog and let it collect data. Tools like Google Analytics and Adobe Site Catalyst can be installed on the back-end of your blog. These tools track everything from new visits, to time spent on pages. Analytics can also track, where your visits are coming from, if the visitor landed on your blog by an organic search(1) or by a paid keyword(2). These tools can be configured to your liking and they provide detailed information in reports that can be customized and delivered automatically. 
If you have been following this post from the beginning, you should have a Google+ account. That’s all you need to create a Google Analytics account. The interface is very simple and Google provide great documentation for it. You can also take a look at the Universal Analytics brand new tool from Google in this post. Here's a great post about how to use Google Analytics.

Study Your Audience and Write Accordingly to What They Want

Finish your blog posts with specific questions; you’re going to start knowing your visitors based on the answers you get.
You can also try sending surveys via email or post these surveys along with your blog post. This is a quick way to understand what your visitors want. You can start writing about what your visitors wants once you get the necessary data about them.
Again, use social media to interact with your users. Learn from them and become their friend. Participate in communities your visitors visit frequently and learn as much as you can from them.

Use Great Designs on Your Website

Make sure you visit different blog sites to see and learn the trends used. Stay away from using bright colors that can cause temporal blindness on your audience, and use one font type for your posts. Use pictures and videos related to what you’re writing about and listen to feedback from your visitors.

Reply to Comments

Interacting with your audience is just another way to increase traffic to your site.  Make sure you interact with them when they leave a comment. Even if it’s a simple “thank you,” from your part; they will be grateful and come back to visit your blog. Replying to the audience comments creates a great discussion environment. Try to avoid religion or political comments unless your blog was created for these purposes.


Conclusion

We talked about using social media to interact with people and expand your blog to different audiences. We also talked about creating a Google Analytics account and installing these tools in the back-end to learn about your audience. Along with that, we took a look at studying your audience, using great designs and interacting with your visitors. I hope I was able to help you and my words encourage you to start writing about the things you really love.
 

One more thing…

Keep posting and don’t be discouraged if you had a few visitors this week. Don’t give up and be consistent.

Do you have any ideas on how to start bringing blog traffic your way?


References
Seomoz.org
dauofu.blogspot.com
Google.com/Analytics
http://en.wikipedia.org/wiki/Keyword_advertising


Customized Google Analytics Reports, Segments and Dashboards for the New Comer

Custom Analytic Reports Take Some Expertise

There is some tremendous power in building custom analytic reports, dashboard and advanced segments in google but lets face it, they can be tricky to setup for a new comer and its difficult to know where to start. Google provides some prebuilt solutions Google recognized the need for prebuilt reports and that not everyone is an analytics wiz or has the resources to hire one. To solve this problem they have created some predefined reports, dashboards and segmentation. http://www.google.com/analytics/learn/solutions-gallery.html

They categorize the prebuilt solutions by:
  • Analytics Solutions – Dashboards, Custom Reports and Advanced Segments
  • Business Objective – Publisher, Ecommerce, Branding, Lead Generation, Support
  • Marketing Function – Social Sharing, SEO, Engagement, PPC, Acquisition, Mobile, Site Optimization

A look at some of the Dashboards and what they do

Dashboards pull together various widgets into a single view and might be tailored around a particular function or activity.

Social Media Dashboard

The Social Media Dashboard provides multiple widgets giving data about impact of social media including: most socially shared pages, On-Site Social Actions, Traffic from Social Networks, Social & Quality from Mobile.
This is a great place to start looking at the return on your social media efforts. The nice thing about all of the prebuilt solutions is that they can also be a starting point and can be tweaked and customized to your needs. To get the most out of your social content you will need to modify tracking code for things like facebook and twitter buttons. Google +1 buttons will automatically track without any needed changes. See https://developers.google.com/analytics/devguides/collection/gajs/gaTrackingSocial

Site Performance Dashboard

Google describes this dashboard as one that can help identify issues with your pages or servers’ it gives information about the speed of a page load and other metrics related to server and page performance.

A look at some of the Custom Reports

Custom reports allow you to pull and filter the metrics you want to see in a single page. Here are a few from the solutions gallery.

SEO: Referring Pages

This gives you insight into the top referring pages including the source, referral path and the average visit duration. You can see this type of information without a custom report by going to Traffic Sources>Sources>Referrals but then to see the path you must click on one of the domains. The nice thing about the SEO referring pages report is it gives you that information in a single page.

Paid vs. Organic Search Performance

This report is supposed to give you insight into the performance of your organic traffic versus your paid search traffic. When I looked at this report it wasn’t clear to me what was paid traffic and what was organic. I added Source/Medium as a secondary dimension and then was able to quickly see if it was organic or CPC. Again this shows that the predefined solutions can make good jumping off points instead of having to start from scratch.

Advanced Segments

Segments allow you to view data around a specific kind of traffic and look at all the reports for that particular segment or compare to another segment. http://support.google.com/analytics/bin/answer.py?hl=en&answer=1033017
After creating a segment you can then go into one of your reports then filter it out according to that segment.

Engaged Traffic

An example of a predefined segment from the Google Analytics Solutions is engaged traffic. This will give you information about those that spend more then 3 minutes on your site and view at least 3 pages.

Good Starting Point

The solutions gallery is a great jumping off point to see how you can segment your users, customize your reports and see all the information you need in a single dashboard. You can see how they setup the customization then begin creating some on your own or modifying what they provide.

Learn More

You can learn more about Google Analytics Solutions Gallery by visiting

Online Privacy Laws for Countries

Now that I have done some thinking and writing about privacy concerns posed by Web Analytics (Oh and I need to make sure I use the right word, read article to see why), I was prompted to research on the privacy laws of different countries[1]. This was an interesting research, considering the various stages different countries are in the current web world. US, an obvious choice, EU & China are some that I have tried to research on for their internet privacy laws and provided some snippets here. 

Before jumping into the privacy laws, an interesting image I found online triggered an equally interesting thought. Does anyone associate themselves with this image based on the country he/she lives in? I don't, rather I cannot! Almost every country in the current web analytics world has most of their internet users tracked some way or the other. So, there is no way for us to think that we are the only ones in there. There is always someone "watching".

Picture Courtesy [2]: How many people do you think will ever feel this way in the current digital world?


While researching on privacy, I found an interesting analogy and thought to quote that as well[3]. This is an analogy of Google Analytics to privacy.


"A parent standing on a street corner counts the number of cars that drive pass a school gate. They are interested in safety and traffic flow. Hence they count the number of cars passing per minute, note their type e.g. car, SUV, buss, lorry etc., take a note of their speed and any other factors, such as weather and amount of day-light. All users of this particular section of road are effected by such data – the local commune, parents, children, teachers, commuters, shops and business, and delivery companies.

The observer has a legitimate reason to observe and measure traffic conditions and there are no privacy issues with this. No personal identifiable information (PII) is collected and traffic is reported in aggregate. That is, individuals are not tracked. This is how Google Analytics works."


Now looking at the bigger picture, privacy is split up as; 1. Personally Identifiable Information (PII) or 2. Non PII [4]. The non PII is used to track the trends or person's behavior on the website, which can help companies with several of their studies. Most countries have concerns with companies collecting the PII from customers without being transparent of not informing them about this data collection.

Let's start with one of the most intriguing growth stories of the past decade, CHINA. It is a different story when it comes to internet privacy here. It is not just the eCommerce or web analytics companies that track customer data, but it is the government [4] that wants to track online journey of its citizens. The Chinese government intends to control all or most of the web content usage and flow to ensure nothing against it is mentioned anywhere in the web world. An example of this would be the Chinese journalist, sentenced to 10 years of prison for having sent a "private email" with some of his views on Chinese government. Knowing this, I would probably think twice to browse internet if and when I go to China. 

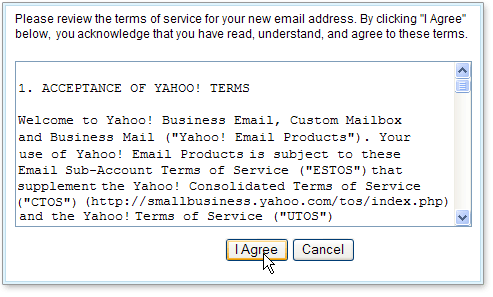
Coming to the other union of nations, EU, the recent EU privacy law does require companies to make its tracking more transparent by taking consent from the customer if they agree to have their data tracked/shared. How many of you would read through the entire terms of service when you download a software, make an online transaction or are even asked to sign/acknowledge before agreeing to them? Would we then even consider to read through the long terms of service detailing how our privacy is at stake if we agree to them?

http://us.i1.yimg.com/us.yimg.com/i/us/smbiz/gr/help/bm_accepttos.gif

Though a welcome sign by the EU to direct companies in taking customer consent before collecting their PII, how much of this new law would really reduce privacy intrusions will need to be seen... 

One would consider US to be a more "free" nation when compared to China. But, as I write this post, here is a latest update on the internet privacy law in the US. CISPA is being reintroduced by some leaders which would give access, to companies and government alike, to collect private customer data in the name of national security. To what extent would this bill be hampering the privacy of customers in the US? Do we need to be worried as to how our data will be used? One could argue that with the growing knowledge and concern of cyber security threats, it is in the best interest of the nation to have active tracking of individuals' online activities. But, where is the line that would define what level of tracking is actually needed for the purpose of identifying and controlling such threats? Has China, with its vast control of internet traffic, been able to control cyber threats/attacks? With the kind of technological advancements that we have achieved, is there any other way to keep track of online activities without needing to have private data.

References:
[1] Digital Analytics Association - http://www.digitalanalyticsassociation.org/?page=privacy
[2] http://glassboard.com/blog/2012/07/18/recent-privacy-policy-gains-hellooo-mobile/
[3] Advanced Web Metrics:Measuring success - http://www.advanced-web-metrics.com/blog/2012/10/04/privacy-web-analytics-google-and-ketchup/
[4] Wikipedia.org - http://en.wikipedia.org/wiki/Internet_privacy