Showing posts with label Marketing. Show all posts

Tuesday, February 18, 2014

Who's Who: Cross-Platform Customer Identification

Customers want [and expect] relevant ads but want control over their data1 but how do we identify those customers and their preferences across multiple platforms?


Currently most industries are only using the two most common methods, PII (Personal Identifiable Information) and cookies.2   PII such as site authentication while highly accurate only applies to a fraction of site traffic – the authenticator must have an account and must be “logged in” to that account.  Cookies are device specific text files created by a site with data regarding that specific device and session, these files can be read by other web sites and are therefore able to provide data.

But what happens when we use more than one device and don't sign in all of them?

Device Usage
Courtesy of http://blog.limelight.com/2013/02/how-are-you-adapting-your-marketing-to-mobile/ 3
With the introduction of so many different devices a person may

  1. Read an email about a product on their phone on their way to work 
  2. On their work computer they begin researching the product using two different browsers
  3. At home they show their significant other on their tablet
  4. Finally before going to bed place the order on their personal desktop

From the business’s reference point they received a number of unique visits and a purchase with no prior browsing history.   

This scenario or something like it is common but how can this company connect the dots and deliver relevant content without knowing anything about the customer? 

This type of customer Forrester Research calls a PCC (Perpetually Connected Consumer).  In the US, by the end of 2012, 42% of online adults met the Forrester definition of PCCs, up from 38% in late 2011.  Globally, Forrester predicts that by the end of 2013, close to half of online adults will be perpetually connected.4

The way to identify this growing type of customer isn’t always clear for each business especially when considering a respective business’s current status on customer identification but one thing is for certain, a business will need more data, lots more. 

One suggested method is getting a DMP or data management platform.  Jack Marshall from Digday describes it as a data warehouse used for storing and analyzing information specifically pertaining to marketing.5 

Whether you build or buy you will be faced with the same concerns
  • Cost of implementation and data collection
  • Scalability
  • Privacy infringement 
Of those concerns arguable the most important is that of privacy, according to Visioncritcal.com privacy and big data are on a collision course. 6 While cost and system scalability can worked on internally how customers' data is used will be a reflection on the company. 


References 


1 Online Users Say They Want More Relevant Ads, But With Privacy Controls Attached. (2013, November 8). http://www.marketingcharts.com/wp/online/online-users-say-they-want-more-relevant-ads-but-with-privacy-controls-attached-38009/
2 3 in 10 Retailers Unable to Identify Customers at the POS. (2012, February 2).  http://www.marketingcharts.com/wp/direct/3-in-10-retailers-unable-to-identify-customers-at-the-pos-20948/
3 http://blog.limelight.com/2013/02/how-are-you-adapting-your-marketing-to-mobile/
4 O’Connell et al. (2013, August). Solving The Cross-Platform Targeting Riddle. http://acxiom.com/solving-cross-platform-targeting-riddle/
5 Marshall J. (2014, January 15). WTF is a data management platform?. http://digiday.com/platforms/what-is-a-dmp-data-management-platform/
6 Grenville A. (2013, December 4). Privacy and big data on a collision course. http://www.visioncritical.com/blog/big-data-collection-and-privacy-concerns

Saturday, February 16, 2013

Uploading Costs to Determine ROI


      So what it the point of all of this analytics? Is it to run frequent reports and setup custom dashboards? Is it to print fancy infographics that tell a story without providing any real insight? Analysts need to realize that the reason why companies invest efforts in employing these tools is to simply generate more money. Sounds obvious. Yet many organizations blindly implement web analytics tools without developing strategies and measurements that allow for insight into the effectiveness of marketing campaigns across all ad networks. Without an effective way of measuring the ROI of all web based advertisement campaigns, companies can not gain insight into which techniques are generating the most money. 
       
     Google Analytics provides plug-ins that provide easy ROI reporting for advertisement campaigns that are generated through Google's online marketing tools. Information about advertisement campaigns implemented in Google Adwords can be linked to a GA account to allow for the baked in reporting tools to be used in Adword ROI analysis. But what about other online advertisement campaigns (Facebook,Bing, partner sites)? If the goal is to utilize analytics to make money, then organizations need to analyze which advertisement campaigns are the most effective across all ad networks .
                 
       GA provides tools for users that allow for non Google ad network cost data to be uploaded from files (excel spreadsheets) into the GA suite. Uploading daily costs data allows for a one stop web analytics experience where all relevant online advertisement costs and statistics are merged together, allowing for reflection on the effectiveness of specific marketing efforts.

Where to Start?

        Before we can start uploading data into GA, we need to make sure our advertisement links are created in Google's URL builder tool. Utilizing the builder allows us to maintain effective management across campaigns, mediums, and sources[1]. Please refer to Bryce Bagley's excellent post excellent post on how to accomplish this.


      Once our URLs have been built, we then need to develop a spreadsheet that contains information that will allow us to track what campaigns we are currently running, what kind of traffic they generated, and how much they cost. Advertisement tools outside of Google’s ad network also can provide these same statistics. Google provides guidelines on what data can be uploaded and it's format.[2]


     Before we can start uploading data into GA, we need to make sure our data is formatted in a specific way that allows for Google's API to read it. Companies should format spreadsheets according to the dimensions and metrics shown in the table above. However, many companies may have spreadsheets that look similar to this one.


      Google’s data upload API is unable to read the file due to the titles in the columns being unrecognizable by the tool. However, it is easy to reformat into a API friendly file.


     You will notice that the spreadsheet contains aspects such as source, medium, and campaign name which refer back to the original URL that was generated for our advertisement link. The data will upload and associate itself to the specific campaign that we created. [3]

How to upload the Data

     Before we can upload the data, we must make sure that our spreadsheet file has been formatted appropriately and saved in the .CVS file format. This format is an option when saving files in excel. Once our files are ready, we can upload our data using Google’s free self service API or an independent GA application provider for a cost.

Google's Self Service API:

This method involves an intermediate knowledge of how to utilize API's and a small bit of scripting logic. Due to this falling outside the realm of this course, I have attached several tutorials on how to set up API access in Google's developer tools and how to enable data uploading in GA. [4]

API Demo

Independent Application Providers.

     Many companies have developed tools that allow for easy data integration from excel into GA. These tools provide the same functionality while providing an easy to use graphical user interface. A tool provided by Next analytics provides the ability to pull informaton from the web into excel for analysis, while another another application by GA DataUploader pushes data from excel into GA. For more information on applications that provide additional tools in GA please visit the App Gallery. [5]


GA Data Uploader Demo

Analysis through Reporting

     Once the data has been uploaded (which can take up to 12 hours) we can take a look at the effectiveness of the campaigns in relation to one another using the built in GA tools.

     Organizations must look at ROI holistically. Viewing a report showing the ROI analysis of a single advertisement campaign only tells you only a part of the story. It is through the compiling of all advertisement endeavors that allow for an understanding of how our efforts are effecting the bottom line. Yet even then, organizations need to continue to revisit the ROI that the analytics team bring to the table.

References:


Wednesday, February 13, 2013

Deciding Who Wins

Attribution Modeling


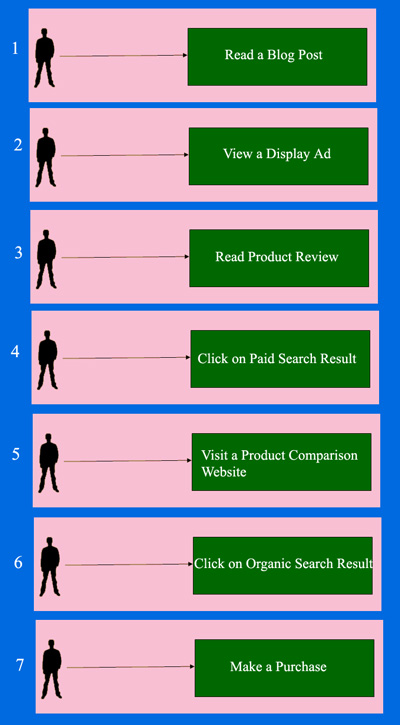
        Attribution Modeling is not necessarily a fascinating topic, but it is very useful to know.  I would compare it to making pancakes; it's not exciting or very difficult to understand, but everyone should know how to make them.  You may be thinking, "what in the world is attribution modeling?"  I had no idea what it was before researching for this post.  Basically, it is the use of different models containing a set of rules that are used to determine who gets credit for conversions.  This can be very helpful if you have multiple departments all claiming credit for the increased revenue.  Or denying credit when that revenue decreases.  Attribution Models assign which touch points get which percentage of the credit.  Different types of businesses will want to use different models.  Here are a few common models used today:

1. First Interaction
          The first touch point in the conversion path receives 100% of the credit for the sale.

2. Last Interaction
          The last touch point in the conversion path receives 100% of the credit for the sale.

3.Time Decay
          The touch points closest in time to the conversion get more credit than those farther in time.

4. Position Based
          The first touch point receives 40% of the credit, the middle receives 20%, and the last receives 40%.

5. Linear
          Each touch point in the conversion path receives equal credit for the sale.


        There are of course, other models that can be used and some companies will even make their own custom models.  It all just depends on the industry you are in and what you are trying to accomplish.  Choosing which one is best for your business can be tricky, but thankfully there are tools for helping you choose.  These tools allow a company to select 3 different models to compare.  The results from each of these models can then be used to pick the model that works best.

        Knowing where to "attribute" credit will help you make decisions as well as make your employees happy.  Customers make purchase decisions at different times and in different places and you need to be able to see where they are coming from.  This is where multi-channel funnels come in handy.  These help you see all of your digital marketing channels all at once and assess the effectiveness of individual marketing efforts.  Once that is done, credit can be attributed accordingly using the model you choose.  

          There are some things to be aware of in regards to attribution modeling, no matter how important it is.  One thing to keep in mind is that for most social media sites, they are the first touch but very rarely the only touch, so they often don't receive the credit they deserve.  Another thing to be aware of is the digital nature of attribution modeling.  All models are based on online analytics and does not take into account all the off-site effort that goes into marketing, which can sometimes be much more than on-site efforts.  The last thing I'll mention is the limits everyone faces with tracking conversions over multiple devices.  It happens a lot that the conversion path is split up between a few devices and each one is recorded as a different user, so be aware of that.  The moral of the story, don't get caught up in attribution modeling. 

        Some of you may be reading this and thinking that attribution modeling is yet another necessary evil, and you'd be half right.  It is necessary to have and can be very beneficial to your company, but it is not evil.  It is cheap to implement and track as long as you already have an analyst that can work with Google Analytics.  If you don't have an analyst I think it's about time you got one.  Welcome to 2013, where business decisions are based on data.

References

Now Serving: Relevant local content

Let's assume that you have a website that does business in many markets, even internationally. Naturally, your web-team tells you to optimize your site as much as possible. You tell them to go ahead, but you wonder if you are missing something - then you hear in the back of your mind something your marketing professor drilled into your mind: Segment, segment, segment! Geographic segmentation specifically. You talk to your web-team lead and they start working on something called "Geotargeting".

Saturday, January 26, 2013

Segmentation Please

     Any web analytics expert will tell you how important segmentation is for your overall measuring strategy. Visitors that come to your website are never going all be the same. They will never have the same characteristics and they will never act the same or be looking for the same things. (1).  Yes, many of them will have some of the same attributes but they will never have the exact same attributes. This provides analysts with the ability to group visitor and analyze how each of those groups contribute to the goals of the site. This post will summarize some high level steps on choosing segments and how to use them to your benefit. 


I need to segment…Who do I segment?

   The answer to that question really depends on your business and who your customers are. Who you decide to segment should help you get closer to understanding what groups are affecting your KPIs whether positive or negative. There are segments that pretty much apply to all ecommerce sites, which I mention below, and others will be up to you based on your business and the activities visitors perform on your site. (3)

Marketing Channels

   The first segment that most site owners can focus on is their online marketing channels. These are channels used, and usually paid for, to get visitors to your site, also known as your traffic sources or acquisition channels (2).  It is important to determine how each channel is contributing to your sites KPIs and if those marketing channels are providing a return on investment.  These channels can include PPC, SEO, email, display, social, direct, and possibly others.   When comparing the time and costs that each of these channels take to provide visitors and metrics do they provide an increase in KPIs? You can make actionable decisions on those channels based on their affect . If the channel is under performing, it needs to be determining what can we do to improve and optimize or do we need to reduce the amount of time and effort we put into that channel?


Orders from the PPC segment


Geo-Locations

   Visitors will behave differently based on the locations that they are visiting from. Analyzing the areas of the country, or maybe even the world, can help site owners determine which areas are most profitable, purchase the most products, or are most responsive to internal promotions. Once analysis is done to determine which geo locations affect KPIs promotions and targeting can be positioned to those areas to improve conversion and revenue.  Site owners could also use this information to investment more on online marketing for areas that are performing well to attempt to drive engagement.  

Visitor Behavior

    We have already looked at how visitor behavior can change based on where they come from and where they are located, but we can also group visitors by the level of engagement they had with the site. Visitors who have had a certain number of visits or consume specific number pages per visit can have different affects on your KPIs and secondary metrics. (2) For example, visitors who have 3 or more visits may be more likely to convert and may not need to be sold to as much as those who are on there first time visitors. Internal marketing messages can be more focused and provide rewards to those groups that have more engagement with the site.  These segments can also be used in remarketing efforts, for example, if it has been some time since certain visitors have made a transaction on the site or returned for a visit or possibly have come to the site and consume many pages but have not purchased to provide them with marketing efforts to entice them to make a purchase. These could be things like sending emails, do providing display advertising related to products they have purchased or used.

Segments for Strategy

The fundamental use for segmentation is to better understand who the most valuable visitors are and how they interact with the site. We can use this information to determine how well changes to the site and marketing efforts are doing according to our KPIs. (3) Once we know what those high value segments are and we know what changes produce positive affects future strategic decisions can be geared toward those segments.  


For more information on segmentation see Avinash Kaushik's post:

http://www.kaushik.net/avinash/excellent-analytics-tip2-segment-absolutely-everything/


11.Avinash Kaushik, Web Analytics 2.0
33. Eric T. Peterson, Web Analytics Demystified